Category Archives: Visual Thinking

Wall Street Journal False Advertising: Data Viz Edition

Ugh. The deceptive proportional shape rears its head again, this time courtesy of a Wall Street Journal ad I saw this weekend in the print edition. And to be clear, this is an add FOR The Wall Street Journal.


Any average reader looking at the above ad would know instantly that The Wall Street Journal dwarfs its competitors when it comes to reaching senior executives. But any data visualization professional (or mathematician), would know instantly that the Journal is being incredibly dishonest with their graphic. Why? Because the Journal is using the diameter of the circles as comparison rather than the area. And when you use the diameter, you’re exaggerating and essentially telling a visual lie because of how readers process a chart like this.

If you read the detail lower in the ad, the claim is made that WSJ has twice the reach of The New York Times. But when readers see sized circles, they assume the area of the circles is the indicator of the amounts being compared. We can do a quick test to see that that assumption would be completely wrong.:

Overlaying The New York Times circle on top of the WSJ, we see that nearly four of the Times’s audiences would fit into that of the WSJ.


But wait, the WSJ only has twice the audience reach, right? Why is their circle so massive? Because…the WSJ wants to make their audience reach look much larger than it actually is. They want to use data visualization to fool readers into thinking they are even better than the Times in this metric than they actually are. And they do this by using the diameter of the circles.


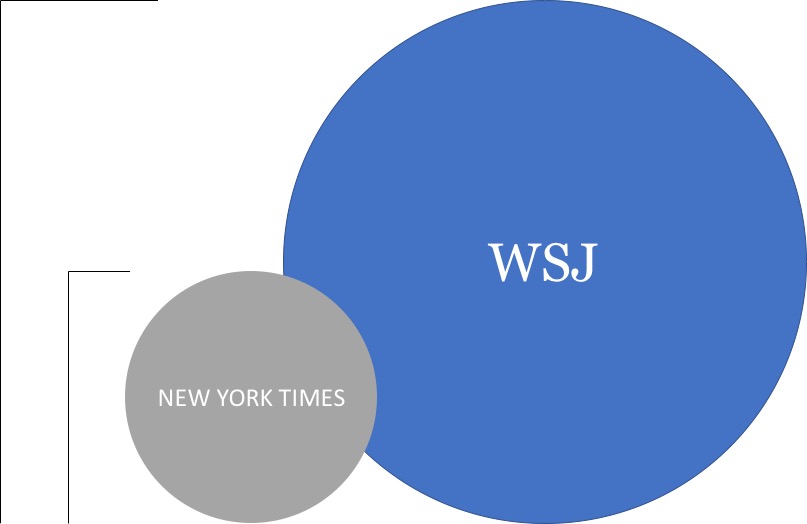
Yes, the diameter of the WSJ is 200% that of the Times. But that’s not how these things work.

A proper use of proportional shapes for this data would look something like this:


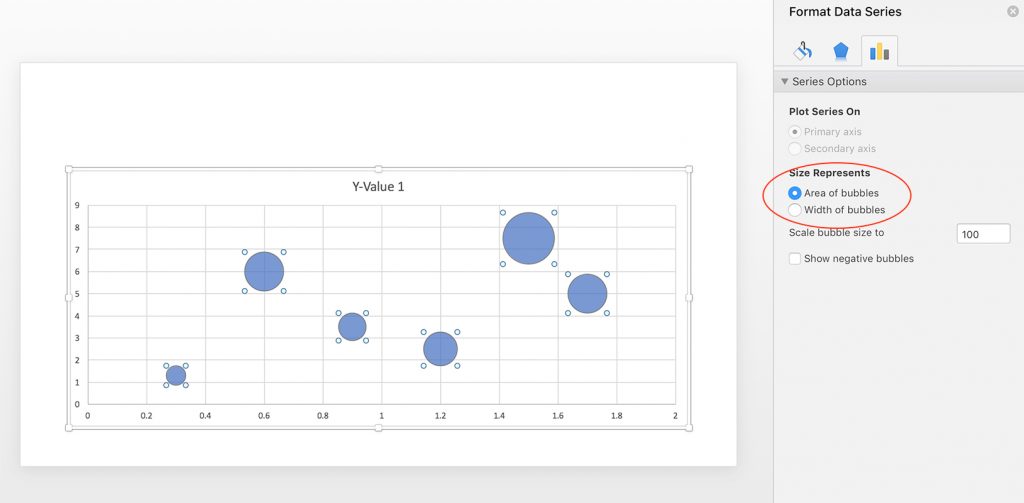
To make matters worse, Microsoft doesn’t do the world any favors by tacitly allowing this kind of data deception. I can’t speak for other data visualization software, but PowerPoint and Excel allow the user to choose either area or width when creating bubble charts–a type of proportional shape visualization.

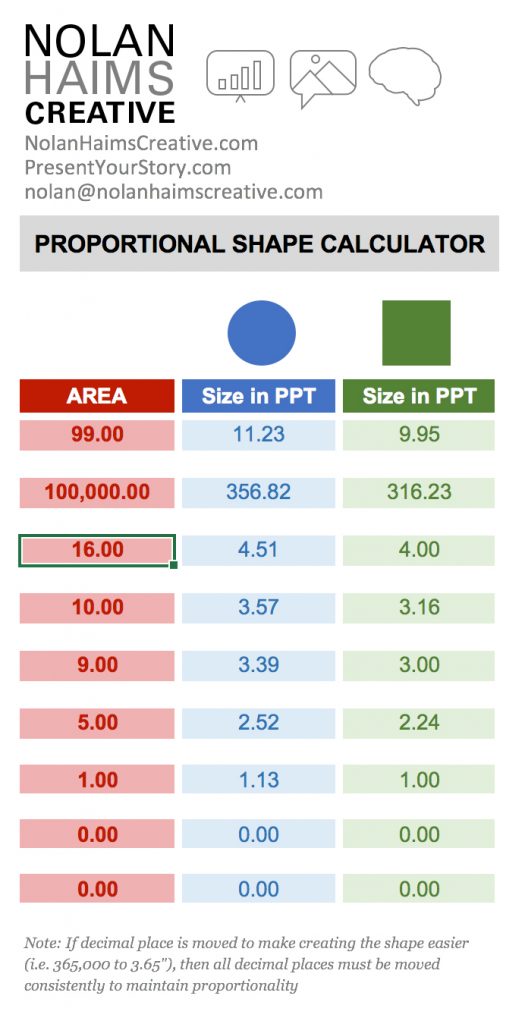
If you’re a user of Excel and PowerPoint, you can use bubble graphs to create proportional shapes for you and break apart the charts into shapes using some hacks, but a far easier way to create properly sized proportional shapes is to use my Proportional Shape Calculator tool–a simple Excel calculator you can download from the goodies page on this site. To gain access to that page, subscribe to PresentYourStory here and you’ll be sent a link with your confirmation email.

FacebooktwitterlinkedinFacebooktwitterlinkedin

W. E. B. Du Bois’ Hand-Drawn Data Visualizations of African-American Life


Holy cow, look at these incredible hand-drawn data visualizations by W.E.B. Du Bois from 1900.

I admit that I knew and know very little about Du Bois and certainly had no idea that he created such visually unique and careful visualizations. The critic in me wants to say that some of these  do not hold to modern best data viz practices, but damn, sometimes you want to get lost in a careful study of data and spend some time with beautiful meaningful graphic design. And that’s what you certainly do with these visualizations.

Check out all of them at Public Domain Review and as so often is the case, major h/t to Kottke.


FacebooktwitterlinkedinFacebooktwitterlinkedin

A Calendar Timeline Slide


We’re always looking to create timelines that are more interesting and more easily read. Recently a client kept talking about upcoming events that “were on the calendar,” and so we decided to ditch the normal linear timeline approach and just show an actual calendar.

I like how this literally visualizes the dates rather than putting them abstractly on a horizontal line.

FacebooktwitterlinkedinFacebooktwitterlinkedin

Better Presentations by Jon Schwabish

dddd

My good friend Jon Schwabish spends much of his time advocating for and teaching better data visualization and communications. And he’s rather amazing at it as one might expect of a Phd Economist who used to work for the Congressional Budget Office. But as someone who also presents quite often, he has now turned his attention to creating better presentations with his just released book aptly titled, Better Presentations. I highly recommend it also with Jon’s excellent PolicyViz blog, podcast and training services.

FacebooktwitterlinkedinFacebooktwitterlinkedin
Categories: Visual Thinking.

Pitch Decks: The Presentation Podcast #16

The Presentation Podcast

Episode #16, Pitch Decks is live.

Sandy is back this week and we’re discussing presentation pitch decks, large and small. From individual “resume presentations” to investor startup decks to massive multi-million dollar agency proposals.

Don’t forget to give us a rating on iTunes if you like the Podcast and want to help spread the word!

Subscribe on iTunes and check out the show notes for more info.

FacebooktwitterlinkedinFacebooktwitterlinkedin
Categories: Visual Thinking.
visual training presentation