Category Archives: Imagery

Slidewise Add-in for PowerPoint

I’m beyond excited for a brand new add-in for PowerPoint called Slidewise from the good folks at Neuxpower.com. 

Finally, you now have the ability to analyze your PowerPoint file for bloated images and video AND replace fonts painlessly without frustrating errors.

Slidewise is being early-released in a pre-1.0 version at a reduced cost, because the creators just want it in as many hands as possible as soon as possible. I already have made this a part of my regular workflows for client projects, and I would urge everyone who has ever wondered why their PowerPoint file is so large or why they just can’t get rid of that instance of Arial, to take a look and try it out.

This is the kind of add-in that pays for itself pretty quickly, but if you would like an opportunity to win a free license, listen to episode of #109 of The Presentation Podcast (releasing today) as we have licenses to give away!

At this point, it is PC-only.

Here’s a little tutorial I put together on Slidewise.

FacebooktwitterlinkedinFacebooktwitterlinkedin
Categories: Design, Imagery, PowerPoint.

PowerPoint’s new Insert Stock Images

PowerPoint has a new and long asked for feature up its sleeve that could save you a ton of money if you’re in the market for stock imagery. Until just recently, there were only two ways you could insert high quality stock imagery from within PowerPoint:

1) Insert Online Pictures performs a Bing Image Search for you. But as we’re all aware, that’s the Wild West, and while you might find a decent Creative Commons image (the default search criteria which can be changed), the quality is limited, and who knows if it’s actually Creative Commons.

2) Office Add-ins such as those for Pickit, Pexels, AdobeStock and Shutterstock, allow you to search and insert imagery from 3rd party sites, but often these require paid accounts.

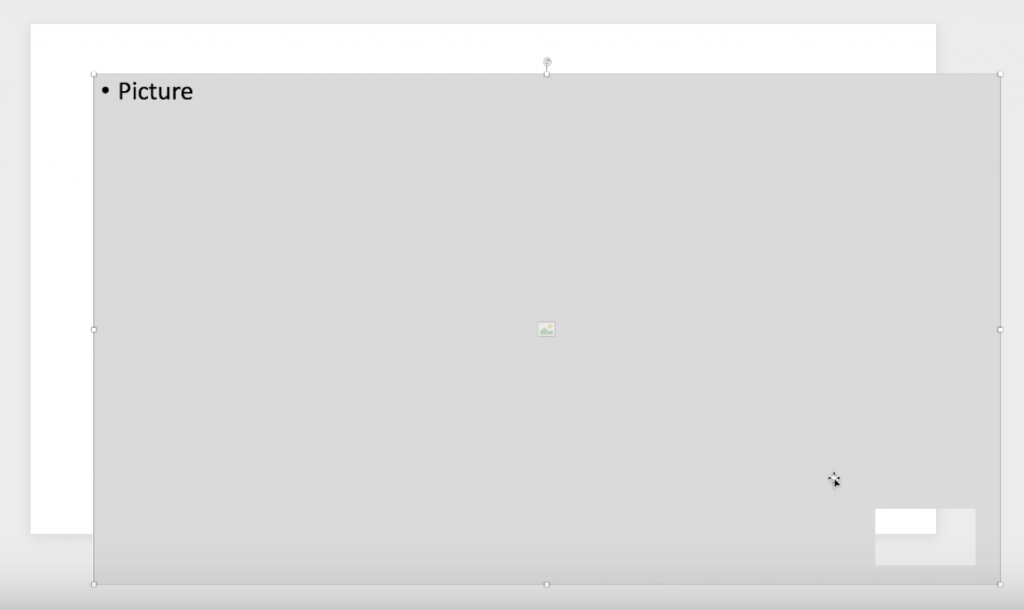
But now, under the same Insert menu where you have Online Pictures, you’ll notice an option for Stock Images.

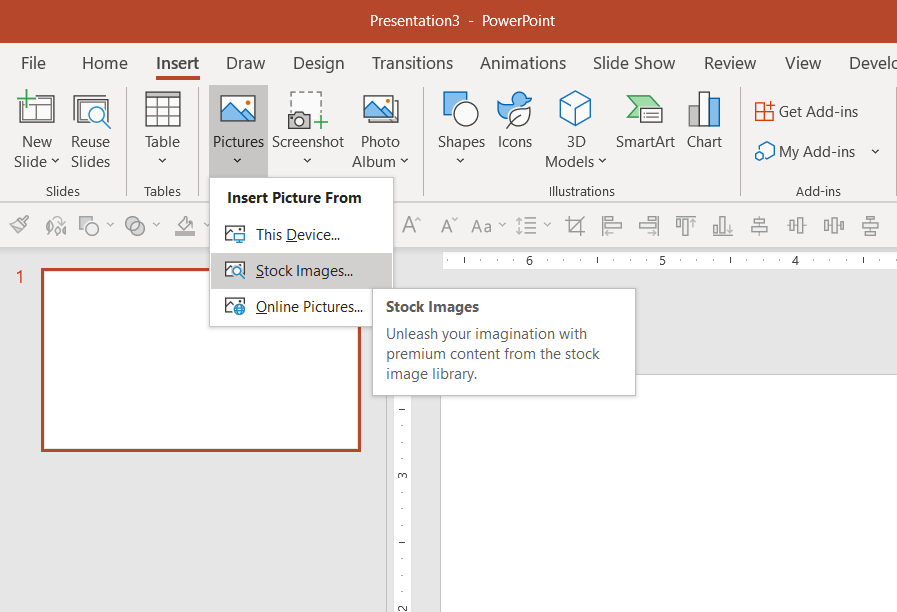
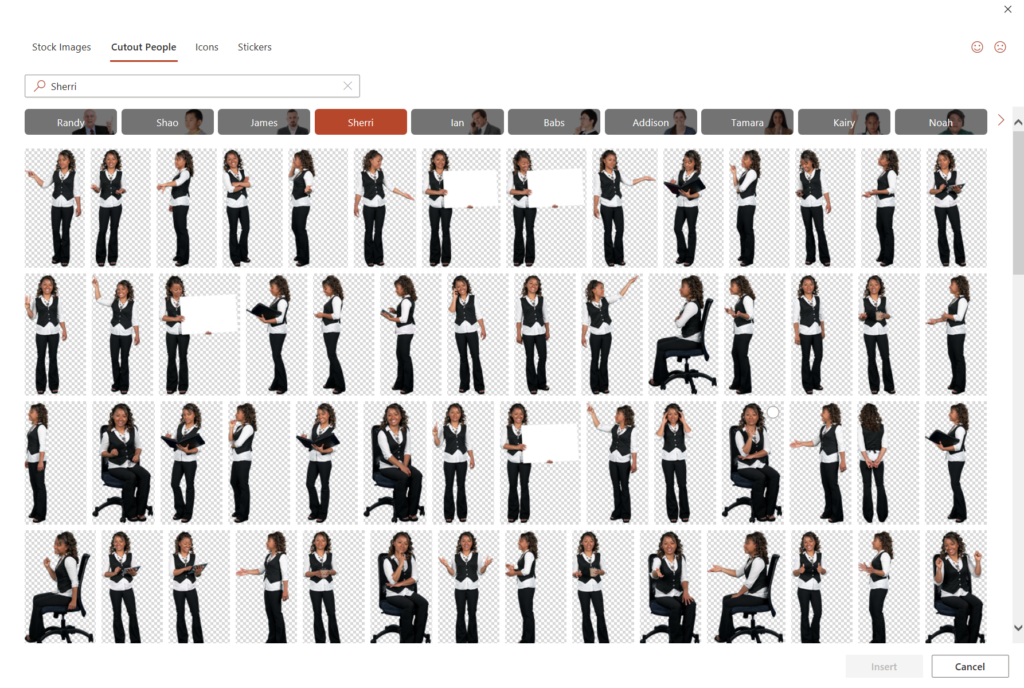
This brings up a new window with four categories: Stock Images, Cutout People, Icons and Stickers. Icons is simply the icon collections we have had for a while, but the other three categories are new and curated by Microsoft. Stickers is cute, but might have limited usage in a business context. Cutout People is a collection of transparent poses categorized by the model themselves, so you can get 50 shots of the same model to use throughout a presentation.

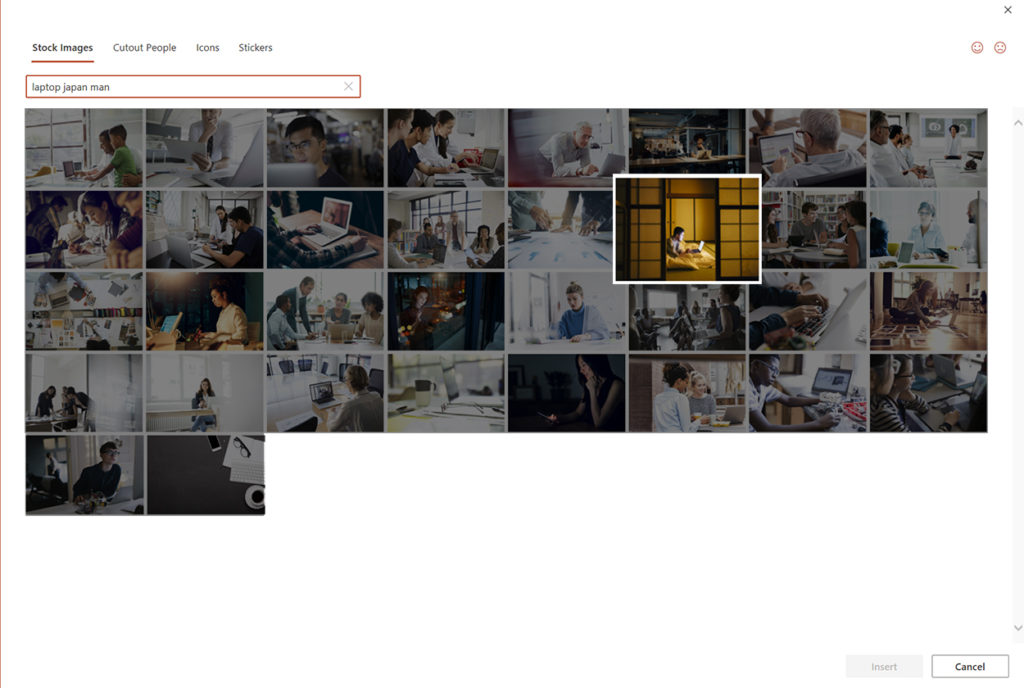
The real prize though is in Stock Images, where you can search and insert high quality professional stock imagery from places like Getty and iStock, and as long as you use them within the context of Microsoft Office (the feature is available in all Microsoft 365 applications), there is no cost to you. Microsoft doesn’t tag the images with their origin, but a little reverse image searching reveals that you can use a particular image without cost OR if you’re so inclined, you could go to Getty and pay a lot. For example, searching “Laptop Japan Man” in PowerPoint returns the images below. You can use that cool shot in the second row for free in your presentation (provided you’re a Microsoft 365 subscriber)…

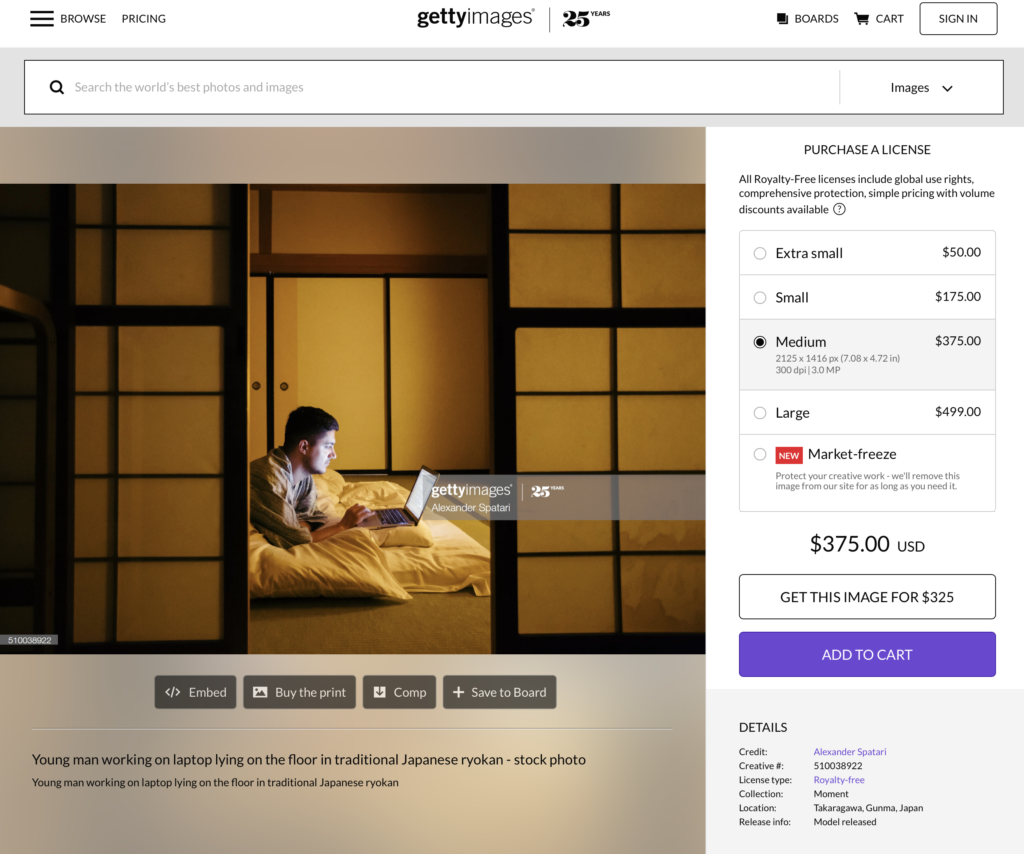
..or I suppose you could also go to Getty Images and pay upwards of $500 for it.

There are a few caveats here—mainly that you can’t extract Office’s stock images for use outside of Microsoft Office. So, while you can use them in presentations all you want, you can’t use them on your website or in a marketing brochure—unless you design the marketing brochure in PowerPoint or Word, I suppose. Also, the feature is currently not available on the Mac. Anyway, we’ve come a long way from ClipArt!

FacebooktwitterlinkedinFacebooktwitterlinkedin

Creating PowerPoint Newspaper Tears


When you need to include a news headline or an article in your presentation, very often we turn to the jagged newspaper tear style.

Here’s a tutorial on how to create and work with these newspaper tears all within PowerPoint—no Photoshop necessary.

FacebooktwitterlinkedinFacebooktwitterlinkedin
Categories: Design, Imagery, PowerPoint.

A Gender-Inclusive (Free) Photo Collection

It continues to be a struggle to find quality stock imagery that addresses diversity, but there’s a new gender-inclusive collection out from Vice that’s worth bookmarking.

In their own words…

The Gender Spectrum Collection is a stock photo library featuring trans and non-binary models that aims to help media better represent members of these communities

It’s only 180 images and many actually manage to still feel stocky, but it’s a helpful addition to the market. Check it out!

FacebooktwitterlinkedinFacebooktwitterlinkedin
Categories: Imagery.

Keeping Logos on Top of PowerPoint Placeholders


If you’re in the business of setting up PowerPoint templates and need a way to create a layout in which a logo or other content always floats on top of an image placeholder, these are two hacks that will do just that for you.

And one will also let you create an image placeholder in any shape you want—not just default circles and rectangles.

FacebooktwitterlinkedinFacebooktwitterlinkedin
Categories: Design, Imagery, PowerPoint.

The Visual Storytelling of Factfulness

Factfulness by Hans Rosling is significant attention as well it should be. Of course, Bill Gates saying it is “one of the most important books” he’s ever read doesn’t hurt.

Like any reader, I imagine, I had my eyes opened continually about misconceptions about the world–which is the intent of the book. But, I’ll always remember Hans Rosling not only for what he said, but how he said it. His TED Talks are famous for his energy, but also for the demos of his Gapminder software that animates bubble charts. Rosling was able to visualize data in such an accessible way, and I wanted to point out two of my favorite examples of how he implemented visual storytelling in Factfulness.

The Chimpanzee

The book is premised on the survey results to a series of questions that Rolling asked audiences all over the world. Predictably, no matter what their education or background, people fundamentally have misperceptions about the world and facts. Each question only has three possible answers, and he makes the point over and over that even a chimpanzee answering the quiz will get on average 33% correct answers. But as we see, even the most educated audiences often score lower than a random guess because of bias. And so, Rosling will add in on the x-axis a “Chimp Point” showing were random correct responses should lie. Here’s an example.

The Picture Superiority Effect in Action

Much of the book revolves around the four income levels as defined by the World Bank which breaks down essentially as:

Level 1: $1/day
Level 2: $4/day
Level 3: $16/day
Level 4: $64/day

You could chart or describe with words these four levels in a million different ways, but Rosling breaks it down to the simplest explanation with pictures of what it means at different levels to
sleep or eat or brush your teeth. Here’s a grid showing just what it means…

It’s a good and fast read, and I definitely recommend it.

And if you want to make animated bubble charts a la Rosling, you can do so in PowerPoint with this hack.

FacebooktwitterlinkedinFacebooktwitterlinkedin

Stretching an Image Without Distortion

I have Photoshop open most of the day and yet, when I need to stretch a photo to fill the entire slide, I almost always use this hack directly in PowerPoint to make it happen without actually distorting the photo.

This also works great when converting a 4:3 presentation to 16:9.

Above is a quick video tutorial on how to do it!

Check out my YouTube Channel for this and more presentation hacks and tutorials.


FacebooktwitterlinkedinFacebooktwitterlinkedin
Categories: Design, Imagery, PowerPoint.
visual training presentation